


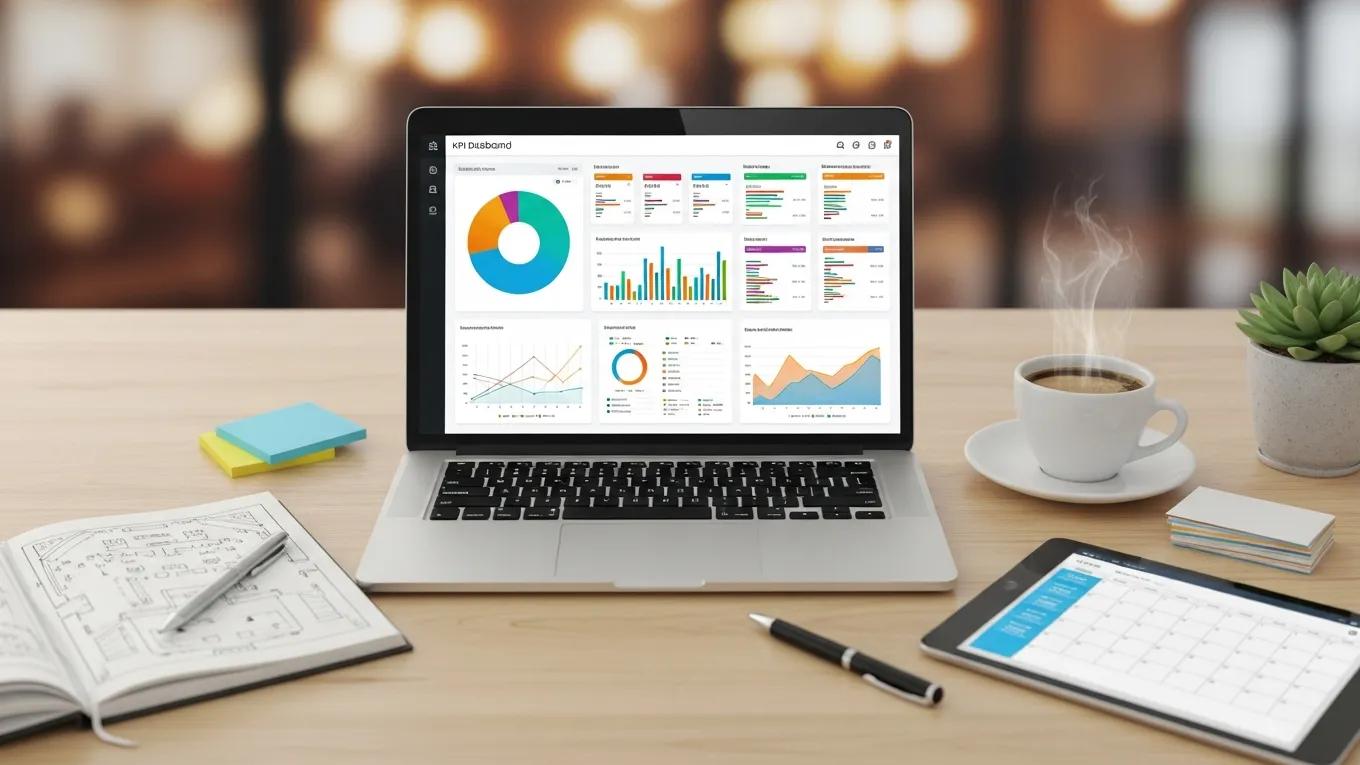
KPI Dashboard Template for Measuring Event Success
By Sarah Forbes Martin, Experience Epic Events
In the realm of event management, measuring success is crucial for continuous improvement and strategic planning. A KPI dashboard template serves as an essential tool for tracking key performance indicators (KPIs) that reflect the effectiveness of events. This article will guide you through the essential metrics to track, implementation strategies, and best practices for effective event evaluation. Many organizations struggle with quantifying event success, leading to missed opportunities for growth and optimization. By utilizing a KPI dashboard, businesses can gain valuable insights into attendee engagement, feedback, and overall event ROI. We will explore the key metrics, how to implement a KPI dashboard, and the features that make it effective for measuring event success.
It is crucial to ensure that the metrics chosen truly reflect success, as misaligned indicators can lead to flawed conclusions and missed opportunities.
Avoiding Misleading Metrics for Event KPIs
Metrics that are misaligned with actual success criteria can mislead stakeholders and divert attention from critical outcomes. For example, tracking the number of tasks completed without considering their impact on project goals provides a skewed view of progress.
Data-driven project monitoring: Leveraging dashboards and KPIs to track performance in technology implementation projects, AU Umana, 2022
Essential Metrics to Track

To effectively measure event success, it is vital to track specific metrics that provide insights into various aspects of the event. Here are some essential metrics to consider:
- Attendee Engagement: This metric assesses how actively participants are involved in the event, including session attendance and participation in activities.
- Feedback from Participants: Gathering feedback through surveys helps understand attendee satisfaction and areas for improvement.
- Lead Generation: Tracking the number of leads generated during the event can indicate its effectiveness in driving business opportunities.
- Revenue Generated: Measuring the total revenue from ticket sales, sponsorships, and merchandise provides a clear picture of financial success.
- Social Media Engagement: Monitoring social media interactions can gauge the event’s reach and impact on brand visibility.
- Return on Investment (ROI): Calculating ROI helps determine the financial effectiveness of the event compared to its costs.
These metrics form the foundation for evaluating event success and can guide future planning efforts.
Implementation Strategies
Implementing a KPI dashboard effectively requires strategic planning and execution. Here are some key strategies to consider:
Defining critical success metrics (CSMs) is a robust approach to ensure that evaluation aligns directly with the core business concerns driving the event.
Critical Success Metrics for Event Evaluation
One method for doing so is a critical success metrics (CSMs). A CSM is an assessment of a running program which reflects the business concerns that prompted the creation of that program. Given pre-disaster knowledge, a CSM can be used while the expert system is in routine use, without compromising the operation of the system.
Evaluation issues with critical success metrics, T Menzies, 1998
- Set Clear Objectives: Define what success looks like for your event by establishing specific, measurable goals.
- Utilize Data Analytics: Leverage data analytics tools to gather and analyze data from various sources, ensuring accurate tracking of metrics.
- Continuous Improvement: Use insights gained from the dashboard to make informed decisions for future events, fostering a culture of continuous improvement.
- Engagement Strategies: Develop strategies to enhance attendee engagement based on the data collected, ensuring a more interactive experience.
Experience Epic, LLC specializes in event planning services tailored for businesses and organizations. Their core offering related to the primary topic is a KPI dashboard template designed to measure event success effectively.
Best Practices for Effective Event Evaluation

To ensure a comprehensive evaluation of event success, consider the following best practices:
- Post-Event Surveys: Conduct surveys immediately after the event to capture fresh feedback from attendees.
- Data-Driven Decisions: Base decisions on data collected from the KPI dashboard rather than assumptions or anecdotal evidence.
- Document Insights: Keep a record of insights gained from each event to inform future planning and strategy.
- Focus on Attendee Experience: Prioritize the attendee experience by analyzing feedback and making necessary adjustments for future events.
What Are the Key Event Performance Metrics to Track?
Key performance metrics are essential for understanding the overall success of an event. These metrics include:
- Attendee Engagement: Measures how actively participants engage with the event content and activities.
- Feedback from Participants: Collecting and analyzing feedback helps identify strengths and weaknesses in the event.
- Lead Generation: The number of leads generated can indicate the event’s effectiveness in attracting potential clients.
- Revenue Generated: Financial metrics provide insight into the event’s profitability and overall success.
- Brand Visibility: Assessing how the event impacts brand awareness and recognition in the market.
- Cost Analysis: Evaluating the costs associated with the event against the revenue generated to determine financial success.
These metrics provide a comprehensive view of event performance and can guide future improvements.
Maximizing Event Success With KPI Dashboard Templates
Using a KPI dashboard template effectively involves several steps:
- Define Clear KPIs: Identify the key performance indicators that align with your event objectives.
- Utilize Data Analytics: Implement data analytics tools to collect and analyze relevant data.
- Engagement Metrics: Track metrics related to attendee engagement to assess the event’s impact.
- Post-Event Evaluation: Conduct a thorough evaluation after the event to analyze the collected data and insights.
- Continuous Improvement: Use the insights gained to refine future events and enhance overall effectiveness.
What Features Should an Event Analytics Dashboard Include?
An effective event analytics dashboard should include the following features:
- Real-Time Data: Access to real-time data allows for immediate insights and adjustments during the event.
- User-Friendly Interface: A simple and intuitive interface ensures that users can easily navigate and interpret the data.
- Customizable Metrics: The ability to customize metrics based on specific event goals enhances the dashboard’s relevance.
- Integration with Other Tools: Seamless integration with other analytics tools and platforms can streamline data collection and analysis.
How to Implement and Customize Your Event KPI Dashboard?
Implementing and customizing your event KPI dashboard involves several key steps:
- Choose the Right Tool: Select a dashboard tool that meets your specific needs and integrates well with your existing systems.
- Set Up Metrics: Define and set up the metrics you want to track based on your event objectives.
- Customize Visuals: Tailor the dashboard visuals to present data in a clear and engaging manner.
- Train Your Team: Ensure that your team is trained on how to use the dashboard effectively for data analysis and decision-making.
What Are Best Practices for Visualizing Event Data on Dashboards?
Effective data visualization is crucial for interpreting event data. Here are some best practices:
- Use Clear Visuals: Choose visuals that clearly represent the data, such as graphs and charts.
- Highlight Key Metrics: Ensure that the most important metrics are easily visible and accessible.
- Ensure Accessibility: Design the dashboard to be accessible to all team members, regardless of their technical expertise.
- Regularly Update Data: Keep the data current to ensure that insights are based on the latest information.
How Can Businesses Optimize Event Outcomes Using KPI Dashboards?
Businesses can optimize event outcomes by leveraging KPI dashboards in the following ways:
- Define Clear KPIs: Establish specific KPIs that align with business objectives to measure success accurately.
- Utilize Data Analytics: Analyze data collected from the dashboard to identify trends and areas for improvement.
- Engagement Metrics: Focus on metrics that enhance attendee engagement and satisfaction.
- Post-Event Evaluation: Conduct thorough evaluations to assess the effectiveness of the event and inform future strategies.
What Insights Drive Continuous Event Improvement?
Continuous improvement in event planning relies on actionable insights derived from data analysis. Key insights include:
- Define Clear KPIs: Establishing clear KPIs helps measure success and identify areas for growth.
- Utilize Data Analytics: Analyzing data allows for informed decision-making and strategic adjustments.
- Engagement Metrics: Understanding attendee engagement metrics can guide enhancements for future events.
- Post-Event Evaluation: Conducting evaluations after each event provides valuable insights for continuous improvement.
How Do Real-Time Dashboards Support Strategic Event Planning?
Real-time dashboards play a crucial role in strategic event planning by providing:
The integration of big data analytics and real-time data collection tools has revolutionized event planning, enabling organizers to gain deeper insights into attendee behavior and enhance overall event success.
Event Success: Data Analytics & Real-Time Metrics
By incorporating big data analytics into the event industry, organisers have not only transformed their approach to planning, executing, and evaluating events but also reaped significant practical benefits. This shift is gaining momentum as real-time data collection tools and analytics platforms become more accessible and advanced. The use of big data empowers event organisers to delve into attendee behaviours and preferences, enabling them to craft experiences more precisely and enhance future events, thereby directly impacting their work and the success of their events.
Data-Driven Decision-Making and Measuring Impacts in the Event Industry, J Heinonen, 2024
- Immediate Access to KPIs: Real-time access allows for quick adjustments and decision-making during the event.
- Data-Driven Decision Making: Dashboards enable data-driven decisions that enhance event effectiveness.
- Enhanced Attendee Experience: By monitoring engagement metrics in real-time, planners can make immediate improvements to the attendee experience.


Leave a comment